At DrDoctor we use New Relic for performance monitoring of our web applications. However web only makes up a small part of our overall system. We make extensive use of a messaging based system and have lots of micro-services which communicate over a messaging bus.
After adding New Relic to our Windows services we soon realized that they don’t really do a good job of supporting them. The main reason for this afar as I can see from reading their docs is that New Relic depends on an active HttpContext for profiling applications.
Having used New Relic to pinpoint the performance problems in our web app, I started to think about what it would take to build something similar but for a Windows Service. This blog post is showing off a proof-of-concept that I’m currently developing.
Introducing Mini Profiler
Mini Profiler is a lightweight c# library written by the folk at StackExchange. It was designed to show performance metrics for web applications, but is flexible enough that I was able to plumb it into our windows services. Doing this is pretty easy:
MiniProfiler.Settings.ProfilerProvider = new StackExchange.Profiling.SingletonProfilerProvider(); //note: not thread safe
MiniProfiler.Settings.Storage = new Log4NetStorage(container.Resolve<ILogger>()); //this is the castle-windsor wrapper interface
MiniProfiler.Settings.SqlFormatter = new SimpleSqlFormatter();
The next step was to create my own custom storage mechanism which would output the results of a profiling session to a log file. This was not entirely trivial, as the profiler session is a hierarchy of steps. Here is how I implemented the Save method of IStorage:
public void Save(MiniProfiler profiler)
{
    var timings = new Stack<Timing>();

    if (profiler.Root.HasChildren)
    {
        var children = profiler.Root.Children;
        for (var i = children.Count - 1; i >= 0; i--) timings.Push(children[i]);
    }
    else
    {
        timings.Push(profiler.Root);
    }

    var intro = string.Format(@"{{""Timestamp"":""{0}"",""Application"":""{1}"",""Status"":""Starting"",""TransactionId"":""{2}"",""Transaction"":""{3}""}}",
                    profiler.Started.ToString(DATE_FORMAT),
                    applicationName,
                    profiler.Root.Id,
                    profiler.Root.Name);

    logger.Info(intro);

    decimal runningDuration = 0;

    while (timings.Count > 0)
    {
        var timing = timings.Pop();
        var name = timing.Name;

        decimal customTimingDuration = 0;

        StringBuilder sb = new StringBuilder();

        if (timing.HasCustomTimings)
        {
            foreach (var item in timing.CustomTimings)
            {
                customTimingDuration = item.Value.Sum(v => v.DurationMilliseconds ?? 0);

                decimal customOffset = runningDuration;

                foreach (var item2 in item.Value)
                {
                    customOffset += item2.DurationMilliseconds ?? 0;
                    logger.Info(string.Format(@"{{""Timestamp"":""{0}"",""Application"":""{1}"",""Status"":""Processing"",""TransactionId"":""{2}"",""Transaction"":""{3}"",""Action"":""{4}"",""CommandString"":""{5}"",""Duration"":""{6}""}}",
                        profiler.Started.AddMilliseconds(Convert.ToDouble(customOffset)).ToString(DATE_FORMAT),
                        applicationName,
                        profiler.Root.Id,
                        profiler.Root.Name,
                        string.Format("{0}/{1}", name, item.Key),
                        item2.CommandString,
                        item2.DurationMilliseconds));
                }
            }
        }

        var offset = Convert.ToDouble(timing.DurationWithoutChildrenMilliseconds - customTimingDuration);
        var msg = string.Format(@"{{""Timestamp"":""{0}"",""Application"":""{1}"",""Status"":""Processing"",""TransactionId"":""{2}"",""Transaction"":""{3}"",""Action"":""{4}"",""Duration"":""{5}""}}",
            profiler.Started.AddMilliseconds(Convert.ToDouble(runningDuration)).ToString(DATE_FORMAT),
            applicationName,
            profiler.Root.Id,
            profiler.Root.Name,
            name,
            offset);

        logger.Info(msg);
        if (sb.Length > 0)
        {
            logger.Info(sb.ToString());
        }
        if (timing.HasChildren)
        {
            var children = timing.Children;
            for (var i = children.Count - 1; i >= 0; i--) timings.Push(children[i]);
        }

        runningDuration += timing.DurationWithoutChildrenMilliseconds + customTimingDuration;
    }

    var end = string.Format(@"{{""Timestamp"":""{0}"",""Application"":""{1}"",""Status"":""Finished"",""TransactionId"":""{2}"",""Transaction"":""{3}""}}",
                    profiler.Started.AddMilliseconds(Convert.ToDouble(runningDuration)).ToString(DATE_FORMAT),
                    applicationName,
                    profiler.Root.Id,
                    profiler.Root.Name);

    logger.Info(end);

}
This isn’t particularly pretty, and I’ll be the first to admit that using string.Format to create JSON is really bad practice, but I wanted something that would be lightweight and work with log4net, which is our current logging library. Really what I should do is adopt semantic logging and use something like Serilog. But I’ll save that for another day.
The next step was to create my own ISqlFormatter, as the ones that come with Mini Profiler included a lot more detail than what I wanted to record, this was very trivial:
public class SimpleSqlFormatter : ISqlFormatter
{
    public string FormatSql(string commandText, List<SqlTimingParameter> parameters)
    {
        return commandText;
    }
}
With these two classes written plumbing it into my application became very easy and I soon had performance results being outputted as JSON into a log file, which I could then import into Splunk.
With the plumbing done, its time to actually instrument our code. With Mini Profiler what you do is call MiniProfiler.Start() and then .Stop() at the beginning and end of a session. In addition to this, you can call .Step() anywhere in between and this create a kind of sub-profiler, if for example you wanted to explicitly measure the performance of a particular part of your code.
When using Mini Profiler you will want to break your code into individual sessions, eg on a website this would be a single web request. With the idea being that you want to be able to measure and compare performance over time.
As mentioned above, the services that I want to add this to all communicate over a messaging bus. So the logical place to call .Start() and .Stop() is in the class that is invoked when a new message arrives on the bus. I also wrapped our database connection code with the Mini Profiler instrumentation code so that it can measure time spent executing SQL and what that SQL was.
Logger Output
After wiring everything up and running through a few test cases, this is a sample of the events that were produced:
{"Timestamp":"05/12/15 13:41:50.22 Z","Application":"ApplicationA","Status":"Starting","TransactionId":"2c9d0f76-cbca-4d4f-b736-48d09a3b75c1","Transaction":"Processor/MessageA"}
{"Timestamp":"05/12/15 13:41:50.24 Z","Application":"ApplicationA","Status":"Processing","TransactionId":"2c9d0f76-cbca-4d4f-b736-48d09a3b75c1","Transaction":"Processor/MessageA","Action":"Dispatcher/sql","CommandString":"select ######### from ##### WHERE (###### = @p1 AND ##### = @p2)","Duration":"18.9"}
{"Timestamp":"05/12/15 13:41:50.22 Z","Application":"ApplicationA","Status":"Processing","TransactionId":"2c9d0f76-cbca-4d4f-b736-48d09a3b75c1","Transaction":"Processor/MessageA","Action":"Dispatcher","Duration":"669.8"}
{"Timestamp":"05/12/15 13:41:50.93 Z","Application":"ApplicationA","Status":"Processing","TransactionId":"2c9d0f76-cbca-4d4f-b736-48d09a3b75c1","Transaction":"Processor/MessageA","Action":"EasyNetQ/Publish/MesageB","Duration":"34"}
{"Timestamp":"05/12/15 13:41:50.96 Z","Application":"ApplicationA","Status":"Processing","TransactionId":"2c9d0f76-cbca-4d4f-b736-48d09a3b75c1","Transaction":"Processor/MessageA","Action":"EasyNetQ/Publish/MessageC","Duration":"4.3"}
{"Timestamp":"05/12/15 13:41:50.96 Z","Application":"ApplicationA","Status":"Processing","TransactionId":"2c9d0f76-cbca-4d4f-b736-48d09a3b75c1","Transaction":"Processor/MessageA","Action":"EasyNetQ/Publish/MessageD","Duration":"5.2"}
{"Timestamp":"05/12/15 13:41:50.97 Z","Application":"ApplicationA","Status":"Finished","TransactionId":"2c9d0f76-cbca-4d4f-b736-48d09a3b75c1","Transaction":"Processor/MessageA"}
Building Splunk Dashboards
Since the data is being outputted as JSON it is really easy to import into Splunk, I’m not going to cover this here. With data in Splunk it’s time to turn the raw data into some useful charts.
The first one is a stacked area chart, which shows the total time spent for a transaction over time. High values on this chart aren’t necessarily indicative of performance problems, as it could just be that we were experiencing high throughput of a certain transaction.
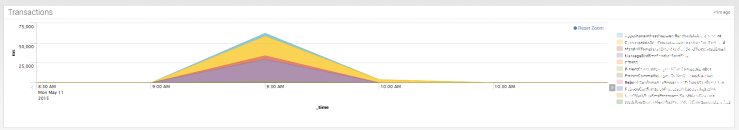
A variation on the chart above would be to show the average duration instead of the total time, that would be more indicative of performance problems.
The next chart shows the total time spent on processing for each different transaction in the selected time period. Once again this chart isn’t necessarily indicative of a performance problem. But does show where our system spends most of its time.

The next chart shows the average duration of a transaction, this in the context of the previous chart could start to highlight potential problem areas. A variation on this chart would be to show it stacked with the number of times the transaction was executed.

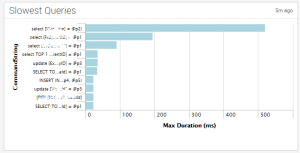
The next chart shows the maximum time it took to execute a SQL statement. This is very high level but still useful in seeing SQL queries that might need to be tuned. Averages would probably be a better values to show here.
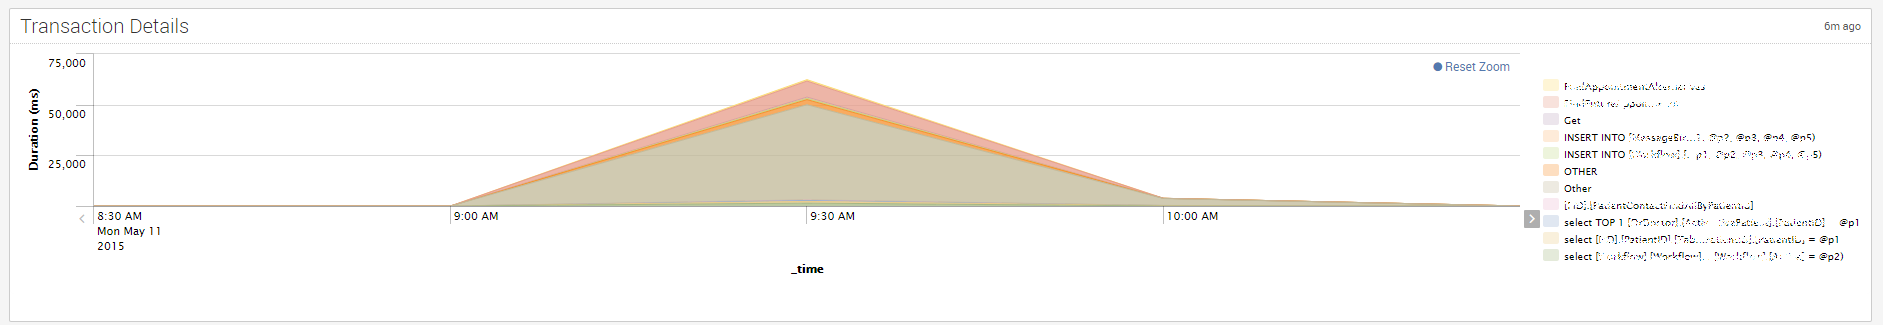
The last chart is a stacked area chart of time spent on the different actions that were measured, over time. This is more useful when looked at in the context of a single transaction type.

As an added bonus, Splunk lets you click on any of the charts and drill through to the raw events.
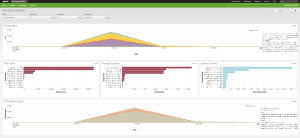
 And here is what the dashboard looks like with everything in place, note also the filters at the top of the page, so I can drill into the different applications and individual transactions – they also cross filter 🙂
This is still very much a proof-of-concept, I’m hoping to get this running in production in the next couple of weeks. When it’s running in production I’ll post a follow up.


